Author: Chris Hudson

  • Road to Hitting Your Quota Territory Plan Package

    It’s that time of year where territories are distributed to the Sales Team. To help your reps understand how to hit and exceed quota, you should deliver to them a Road To Hitting Their Quota Package to help them be successful. What is in a Road To Quota territory package? When the updated territories are rolled out to the Sales Team, providing your reps with a Road To Quota territory plan will help them kickstart their year and prospecting efforts. Best practices are to change up territories typically at the beginning of the year and/or during Sales Kickoff, so presenting a Path To Quota document is a great resource to have them hit the ground running.

    What Should You Include in a Road To Quota Plan?

    The Road To Quota package should include the following:

    • Providing the Methodology Behind the Approach to Territories.
    • The Rep’s New or Updated Territory.
    • The Top Prospect Accounts in that Territory.
    • The Top Customers in a Territory.
    • What is in the Current Pipeline.
    • What is the Pipeline Build Needed to Hit Quota.
    • The Reps Different Ways to Hitting Quota.

    This post will go into depth regarding the above sections of a successful Road To Quota package to deliver to your reps

    Providing the Methodology Behind the Approach to Territories

    You want your Sales Reps to know the methodology behind how you built out the Territories that they are given. Ultimately, the primary objective is to put everyone in a position to be successful. Typically, you want to provide analysis of the territory looking at the historical bookings, what the average sales price is in that territory, what the length of sales cycle is, as well as the win rate. Based on that, you can take a look at the current pipeline and determine a quota based on the strength of the territory. If you have top tier accounts, you should also provide the methodology on how you ranked the prospect accounts in your database.

    The Reps Territory

    Territory Planning East Coast Road to Quota

    The next piece of information in a Road To Quota document should be the actual territory. What are it’s characteristics? If you separate Territories via geographic location, industry vertical, product line, employee size, other other values, you will want to lay that out to the rep so they are clear in what the territory is that they are working. Having a visual representation of the geographic location is also good so they can refer to that in a printed out plan (such as the above).

    Territory Attributes

    Providing information on a territory is helpful in showing a rep the strength of the territory. Since you distributed the territory based on the analysis, why not go over the methodology with them? Things to consider showing would be:

    1) The number of opportunities created in the last year.

    2) How many opps have been won in the previous year.

    3) The Average Sales Price of the Territory.

    4) The previous Win Rate %.

    5) The typical length of the Sales Process.

    6) The historical pipeline.

    7) The Number of Top Tier Accounts to target.

    8) The opp penetration rate of the territory.

    Other useful information to include could be: the number of customer accounts, any greenfield/white-space analysis you performed, and the current pipeline. However, we do cover some of these in other areas as well.

    Top Prospect Accounts in the Territory

    Based on the scoring methodology shared earlier in this document, you can rank the top prospect accounts and provide them in a standard report for a rep to work on. Make sure your rep understands why they are top tier:

    -Do they match your ideal customer profile?
    -Are they actively searching, or have they searched in the past for solutions to business pains that your service can fix?
    -Has someone in the sales organization engaged with the prospect in the past?

    This information can help your sales rep target the top prospects, even creating ‘Account Plans’ to strategically target these accounts, including the help of their SDR or Marketing department if available.

    Customers in that Territory

    Customers can be a great reference to a prospect in a sales cycle. Putting the top Customers in a reps territory in a slide can let them know who to reach out to or be able to reference. On top of the Top Accounts, this information can also show your Sales Reps how many customers there are, what their growth could look like, and what their cumulative revenue is.

    Current Pipeline of the Territory

    Highlighting the current pipeline of the territory will let the rep know which Opps are in what stage, what the forecasted amount is, as well as the total number of opportunities that can currently be worked. This is beneficial for the next component of the Road to Quota document which shows what pipeline build is required for territory to allow the rep to hit their quota.

    Pipeline Build Required

    For each rep, you want to understand what the Annual Quota is, and do some analysis of the Average Sales Price (ASP) is to figure out what the number of Opportunities are needed to close to hit their number. Based on the win rate of that territory, you can back out the number and dollar amount needed from the pipeline to hit quota. You can further segment this down by understanding what the percentage contribution from the different departments such as Marketing and the Sales Development team would be, to figure out how much of the Rep’s own outbound is needed. From this analysis, you can break down the Pipeline needed per month from each of those sources, to give the rep the total monthly pipeline build that is required to hit their quota.
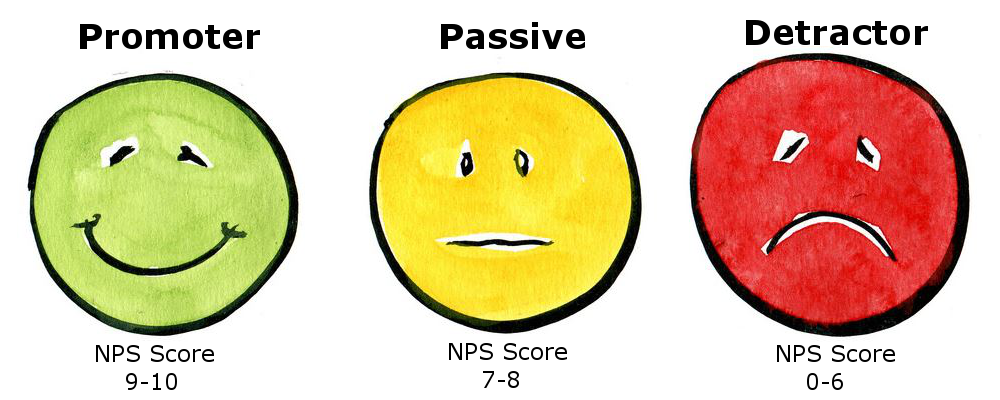
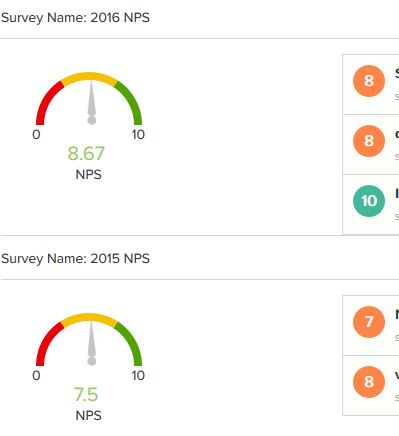
    Conversion Rates

    This particular section of the Road to Quota document showcases both the Conversion Rate across the sales organization as a whole, as well as the rep’s win rate for opportunities. Looking at the previous 12 months, how many opportunities have been created, and how many have been moved to closed won. If you are able, you should provide an analysis of the conversion rates between each of the Sales stages. This can show areas of improvement for the rep and where they are at to the company average.

    The Reps Road to Quota

    There are several different avenues a rep can work at to reach their quota. Using the analysis of the Quota, current Pipeline, and current open Opportunities you can map out the different paths that a rep can take to meet and exceed quota. With the Average deal size being the median range, you can figure out how many deals in which segment to meet the Total Bookings number. The ASP can then be determined from this new segment. You can easily provide up to five different paths for the rep to hit their quota, whether they focus on the average company ASP, mid range, small, or even going after the larger accounts to hit quota.

    This Path To Quota document is ultimately the best way that a rep knows they can be successful with a given territory. What sort of other documents do you use when you update territories?

  • Sales Development (SDR) Metrics That Matter

    The ultimate goal of Sales Operations in a SaaS (Software as a Service) company is to align the overall organization’s roadmap and build & execute on a successful Sales Strategy to create predictable growth in Revenue and New Business. What this involves is building a set of KPIs and Dashboards to drive insightful actions for each aspect of your organization across Marketing, Sales, and the Customer Success teams. At the very top of the funnel is driving “New Business”. There are three functional departments that have this responsibility – Marketing, Sales, & Sales Development. This post will focus solely on the ‘Sales Development’ department. Sales Development is the function of a company that is infamous for ‘cold calling’ or ‘cold emailing’, and the reps are commonly referred to as SDRs.

    I’ve spoken with several colleagues that work in other SaaS companies that are thought leaders in this space, and have gathered the SDR Metrics that matter to them (thanks Jasmine, Stephen, Phil, & Brian!). This post is a summation of my conversations with them.

    SDRs go by many different names in the software industry. They have been known as Business Development Reps, Sales Development Reps, Enterprise Business Reps, Lead Development Reps, Marketing Development Reps, Inside Sales Reps, etc. The goal of this role is to work on the outbound and inbound lead generation and qualification side of Sales, alongside Marketing’s alignment, to build the top end of the funnel.  Whether the SDR team is solely focused on Inbound, a hybrid mixture of Inbound and Outbound, or focused completely on Outbound; their goal is drum up new business and move a lead/company through the qualification process; ultimately passing them off to Sales [the ‘Closers’, commonly known as Account Executives (AEs)], as a Sales Accepted Lead to continue moving the Prospect through sales cycle.

    Being at the top end of the funnel, the SDR team is vital to meeting the overall company goals. Working backwards of the organization or business unit’s goals, and knowing the close rate of opportunities as well as the average deal size – you can figure out the quota that needs to be attained by your SDR team. What are the metrics that are important to measure to understand SDR effectiveness? I’ve broken these metrics down to three groupings – Activities, Outcomes of those Activities, and the Opportunities that are generated.

    There are other metrics that are important, such as tracking the inbound leads that has been generated from Marketing, but I won’t address these ‘warm leads’ in this article. Typically these involve Service Level Agreements with Marketing on new pipeline delivered to the SDR, and the SDR tasks and actions on these leads. Metrics that are important are time between lead creation, conversion, and first call, etc.


    Sales Development Metrics

    Below are a few of the metrics that matter when understanding SDR KPIs.

    SDR Metric #1: Activities

    The first metric that is important to measure is the activities that are being done. Activities have a huge correlation with the the outcomes of the interactions, which ultimately lead to closed won deals. How many dials are the reps making a day? How many emails are they sending? What sort of social interactions are they having with the prospect?

    Activities, and phone calls in particular, are correlated with success. By understanding the amount of dials, emails, and social touches a rep is making a day can influence how successful they are in their job. Moreover, if you’re using a sales enablement tool (Outreach, Salesloft, Tout, Mixmax, etc), you can automate the tracking of these activities into your CRM (such as Salesforce, Zoho, Dynamics, et al)

    A few good reports to have are:

    1. Calls/Day
    2. Calls/Week
    3. Emails/Day
    4. Emails/Week
    5. Social Touches/Day
    6. Social Touches/week

    You can then display these reports into a dashboard of the entire team for the manager & other executives of the organization to view. You might even have weekly SPIFs (Sales Performance Incentive Fund) that incentivize them to make their activities, such as a free lunch or giftcard during team meetings.

    Other metrics that we want to include are also how quickly the sales development team is following up on inbound leads, or things that can be classified as ‘immediately actionable’. Items like these are ‘call me’ requests, ‘demo requests’ and pricing inquiries. These are segmented out from items such as white paper downloads or 3rd party uploads.

    Metric #2: Outcomes

    The second important metric to track are the outcomes of the activities that the SDR team is doing. How many connects is the SDR making – actually getting in touch with someone and having a conversation with them, not just leaving a voicemail? How many initial meetings are being booked by the SDR? What is the time it takes to move opportunities over as sales accepted leads? What are the percentages of initial meetings to sales accepted opportunities?

    The outcomes of the activities that are performed are important as well. We want to be able to view what the outcome of these calls are (aka Call Dispositions). What sort of sequences, or the process of SDR follow up – are more effective than others? Can we A/B test these campaigns to optimize the correct follow up for the different personas of the organization?

    Looking directly at emails, what are the rates of Opens, Clicks, & Responses each email is getting? Can we move the lever towards more conversation?

    A few good reports to have are:

    1. Call Connects/day

    2. Call Connects/Week

    3. Email Replies/Day

    4. Email Replies/Week

    5. Initial Appointments (meetings set)/Day

    6. Initial Appointments (meetings set)/Week

    By running tests on different cadences on different prospects can help refine your follow up strategy. Does the campaign that the prospect is going through have different email and dialing cadences? For example, are you reaching out too much or not enough? Is the content of the email resonating with the role of the person that is receiving it?

    Metric #3: Opportunities

    Opportunities are all about pipeline contribution. Based off of the number of opportunities and what stage they are in, we can predict what the total amount of closed bookings can be within the quarter by relating them to historical figures and conversion rates. The tracking of opportunities is vitally important to understand the effectiveness of the SDR team.

    In this, we want to know – was the opportunity created by the SDR? What is the total number of opportunities that they are creating? When a prospect moves from a qualification stage and is passed over to the Account Executive, what was the amount of the of the deal?

    With this information, we can get relevant insight into:

    1. How effective is the overall SDR team being?
    2. Where are there coaching opportunities to train the team?
    3. How can we move the needle on company objectives if we add another member to the team?


    SDR KPIs that Matter

    The goal of an SDR manager, Director, or VP is to create new business. One of my colleagues has a great visual he writes on the whiteboard for his SDR team. It describes the four quadrants that an SDR can fall into:

    Sales Development Metrics Quadrant
    Thanks for sharing this with me, Stephen!

    In the Top Left Corner, you can see that the SDR is making all activities and goals. In the eyes of the manager or director, the rep is golden & will not be micromanaged. Leadership should focus on the career-pathing of this SDR, and how they can grow within the company.

    In the Top Right Corner, you will see that the SDR is making their goals, but not hitting their activity requirements. This is something that the manager will be curious about, and ask. The nagging question in the manager’s mind is – “could they do better?“.

    On the bottom left corner, the SDR is making their activities and not their goals. Here is a great opportunity for coaching. What are they doing that is different from others on the team? How can the manager help the SDR improve their performance?

    Finally, in the bottom right corner of this quadrant, the SDR is not making the activities or hitting their goals. In this area, the manager’s conversation with their employee will probably be around soul searching. Is this the right company for them? There may be a formal plan involved to have the SDR hit their goals or decide that they are n0ot a good fit for the role.


    Hope you enjoyed this article, and thanks again for all my colleagues that contributed. Leave a comment and let me know what you think!

  • What is a B2B Buyer Persona?

    What is a B2B Buyer Persona?

    Have you ever heard of the term, Buyer Persona? If you are in Marketing, Sales, or Business Development, you will inevitably come across this industry term in one way or another. Since this article is targeted more towards Business-to-Business Sales & Marketing, I will focus on answering the question this way – What is a B2B Buyer Persona?

    A Buyer Persona is a breakdown representation of your “Ideal Customer”. On one hand, for Business-to-Consumer or “B2C” businesses, it could be a certain subset of the population. For example, your niche product or service can target “Female Firefighters between 30-35 who live in New York” or “Male High School English Teachers in Ohio”. There are many different ways to target a niche, and this micro-targeting has been compounded by big data analysis and marketing tools like Google & Facebook advertising.

    On the other hand for B2B companies, a Buyer Persona can target the makeup of your ideal customer and how the organization works in a buying cycle. This can also be referred to as the ‘org chart’. Within a company, you can have different departments and employees with differing goals or objectives, obstacles or roadblocks, concerns or issues to overcome, and responsibilities to manage.

    This Buyer Template should align with whatever your chosen sales methodology is. That is, who is the economic buyer, who has the specific need and/or pain, who is your champion, etc.

    Note: You can check out more about different Sales Methodologies in this link if you’re interested in learning more.

    The individual contributor of a specific role in your Ideal Customer can then be represented by a “Buyer Persona Template” in your sales playbooks. For most companies, each role should have a specific buyer template created for them.

    What Are B2B Buyer Persona Templates Used For

    The reason that we create “Buyer Personas” is to identify the different people that engage with the buying process (whether it is marketing, sales, support, etc), come up with a methodical approach on what their role is in the sales cycle, and identify how your company or service can help. Buyer Personas help by identifying certain targeted material or talking points to reduce that person or department’s concerns and identify ways to get them on your team. Next, we’ll go through a sample Buyer Persona template and each section that can be added to each one.


    B2B Buyer Persona Template

    Below is an example of a Buyer Persona Template:

    A Buyer Persona Template for use in a sales cycle with sections to fill out.

    You will see a few sections on this template. Let’s break them down and how they are relevant.

    Name & Summary:

    Giving a name & face to the buyer is a great mnemonic strategy to help easily recall who they are. You can use a naming convention like “Ivan the IT Manager” (like the cover photo) or “Celeste the CEO” for all personas you have identified that are involved or influence a buying cycle. Matching the first letter of their name with their title helps.

    In addition, a summary section can give a brief overview of how the specific buyer profile interacts with the other personas in the company. Does Ivan report directly to Celeste, or is there a CIO or Director of IT? If that other person is involved in the process, you’ll want to create a Buyer Persona for them as well.

    Responsibilities & Concerns:

    What does Ivan do at the company, and what does he care about? For example, he could be the owner of the business tools and provide helpdesk support to the organization. If your product is a software service, he can potentially be the owner of your tool. His concerns may be how easy it is to provide end user support and administration.

    Goals & Obstacles to Reaching Goals:

    What are the goals and obstacles that this person faces in their day to day? If it is a CFO, they are tasked with staying on budget. Their obstacles could be unpredictable costs & trying to predict future events that can financially impact the business (a slow down in manufacturing, oil prices increasing, etc). How can your service provide an ROI for them?

    Sales Cycle Role:

    At what stage in the sales cycle do they get involved, and what is their role in the Sales Cycle? Are the people in these roles the end users, decision makers, economic or technical buyers, etc. In other words, the goal is to share how you want to message your service to them.

    How your company helps:

    How does your company help in the day to day or overall strategy to the organization? If you sell software that enables collaboration like Slack, you can highlight a single repository of data that could be lost in emails. For a software engineer, this can be remote communication with the team. For a CEO, this can be a great place to share announcements with the company. IT could like the ease of setup and administration.

    Other Information

    In this section, you want to include any key features, the sales challenges to overcome, and how to win them over.

    1. “Key features” include key areas of your product or service that can help the specific role.

    2. “Challenges to the Sale” can be competing priorities, budget concerns, etc.

    3. “For how to win them over”,  highlight how can your service provide an edge over the competition, create an efficient process, pass audits, etc.

    Buyer Persona Example Titles:

    Depending on the makeup of your Ideal Customer, and the organization of specific roles, you could create personas for these different roles or people that roll up to these individual departments:

    1. CEO –

    The CEO is the head of the organization. What sort of things would they care about? Most likely how effective their company is running – profitability, their compensation, their market size, etc.

    2. CFO / Finance –

    The finance department falls under this team. Can be responsible for Accounts Payable / Accounts Receivable, Collections, Financial Planning & Analysis, etc.

    3. CTO / Engineering –

    Under the CTO is the Engineering team. There can be multiple different roles, system engineering, product management, engineering lead, etc.

    4. CIO / Information Technology –

    Roles that roll up to the CIO could be the IT Manager or admins of your tool. Could also be responsible for security.

    5. COO / Operations –

    Operations typically has responsibility over Supply Chain, business reporting, etc.

    6. CMO / Marketing –

    Responsibilities can include inbound and outbound marketing, demand generation, digital marketing (pay per click advertising), the website, etc.

    7. CSO/CRO / Sales –

    The Sales Team can report to a Chief Sales Officer or Cheif Revenue officer.

    8. CCO / Customer Success –

    With the advent of B2B recurring software models, customer success has become more and more important. They care about customer satisfaction and reducing customer churn.

    Hope this article has provided an overview of what a Buyer Persona is and used for! Let me know what you think about this article in the comments below.

  • How To Reset A WordPress Password with No Email Retrieval

    I had a client who didn’t know the password to a WordPress website that I was hosting for them, and they didn’t have access to the email account that was used when they initially created their Website. Since I did not have administrative access to the site, I could not reset their password via the WordPress UI (user interface). What can we do in this situation? Luckily, I still had access to the database tables through my hosting service. This article will show you how to reset a WordPress password with no email retrieval available, by using a workaround resetting the password through the CPanel by accessing the database tables in phpMyAdmin.

    How to Reset a WordPress Password from phpMyAdmin

    The first step to reset a WordPress password is to log into the your Cpanel. Locate where you can access the CPanel, and then login:

    Once logged in, let’s locate and log into phpMyAdmin. In the below image, you can see it is located in the “popular links” section. phpMyAdmin is a way to interact with the database tables via the UI of your CPanel:

    Once inside the phpMyAdmin, we’ll need to locate the correct Database that houses your WordPress installation. Click the Databases menu tab at the top:

    Now, let’s find the correct Database and Click into it. Their naming conventions can be something like “Name_ Once there, let’s look at the available tables. We’ll want to find the WP_Users table:

    Once you have entered into that table, you should see all users associated with that WordPress Install, and be shown the below information:

    Next to the User who you want to update the password, click the Edit link. You will be shown the below screen once it loads. Notice the row that is user_pass. What you will want to do is update the Function to MD5. In the Value area, put in the new password. Note, it will be case sensitive (I put the password as “PasswordGoesHere0?”). After that has been updated, all you have to do is click ‘go’. You can now log into the WordPress WP admin screen, type in the value from User_Login or User_Email with the new password to verify that it works.

    Congrats! You’ve learned how to log into a WordPress Website by resetting the password from phpMyAdmin from your Host’s Cpanel. Does your cpanel look the same as mine? Did you have any issues updating the password? Let me know in the comments below!

  • Campaign Member First Associated Date/Time Field

    Have you ever noticed the difference between the Member First Associated field on the Contact’s Campaign History Related list is a Date/Time field, but if you were to reference the Campaign Member’s First Associated Field on a report, it is just a date field? We want to be able to compare in a report which campaign member was first associated (read: Created) if they are on the same dates. This question came up today, and thought I’d quickly share how we solved this issue. (Thanks for the article idea, Michelle!). This post will show an easy way to run as report of the Campaign Member First Associated field as a Date/Time Field.

    Before we begin, here is an example of the Campaign Member First Associated field on the Campaign History Related List that is a Date/Time field:

    Contact Campaign History Member First Associated Date/Time Field

    And here is the same Campaign Member First Associated Date field on a report that is only showing as a Date field:

    Standard Member First Associated Date in Reports different from Campaign Member

    This is very odd! Let’s quickly fix this by creating a new field. We’re going to look up the date/timestamp of the creation of this Campaign Member being associated with the Contact.

    Note: This post is a follow up to the Campaign Member First Associated Timestamp article, where we go over that the Campaign Member First Associated Date is actually the “Created Date” of the Campaign Member associated with a Contact. If you’re confused why that is, check the article out.

    How To Run a Report of the Campaign Member First Associated Field with Date/Time

    In the above article, we know that the Campaign Member First Associated field is actually the ‘Created Date’ of the Campaign Member record associated to the Contact. The problem is that the Created Date is also not easily reference-able on a Campaign Member report for some reason. I don’t know why this is the case. To be able to run a report of the Date/Time field of the Campaign Member First Associated date, we need to create a formula field referencing the created date and displaying that as a date/time field.

    Creating a Date/Time Formula Field for Campaign Member First Associated

    First, let’s create the field. Select “New Field” from the Campaign Member object in Salesforce’s Setup. Let’s name it “Member First Assoc. Date”. Select the type to be Formula, and Date/Time as the output. The formula is simply the “Created Date” of the Campaign Member. In the Formula Editor, you can either look the field’s API up, or just type “CreatedDate”. Now, let’s check the syntax, and then save the field if there are no errors. On the next step, you can choose to add this to your Campaign Member Layout if you’d like. If you only want to have it available in reporting, there’s nothing you need to do to make it available. Last step is to save the field. You should now be greeted with a new field record that looks like the below screenshot:

    Date/Time field of Member First Associated for Reports

    Now, when you run a standard Campaign Member report, you will see that the Campaign Member First Assoc. Date is correctly pulling the Date/Time field.  You can now run a report to compare different Campaign Members First Associated Date and view them as a Date/Time fields, seeing which Campaign Members were created first, even if created on the same day,:

    Report with new Campaign Member First Associated Date/Time Field

    I don’t know why this is one of the weird quirks of Salesforce, but believe it was a legacy feature. I hope this article helped you if you had the same confusion! As always, leave me a note in the comments below.

  • Salesforce Change Management Best Practices

    After speaking with a colleague the other day, they asked me what are the best practices for change management within Salesforce. This article will dive into how I manage changes in Salesforce using a Salesforce custom object used to build a Change Request app.

    Salesforce Change Management Methodology

    The reason that change management is important is for several reasons; we want to continually keep metadata clean, remove unused processes, and manage our storage effectively. Also, being able to track and prioritize requests helps keep your company’s overall initiatives moving forward. I’ve been the main administrator of a Salesforce Org that went live in December, 2000. As of this writing, that was almost 18 years ago – back when Salesforce was first founded. As I’m sure you can understand, there were fields, apps, and components within that Org that were no longer used and were filling up storage space. One example was the activity history. We were using over 5 GB of that, with them ranging from “Call: Not In” from back in 2004. Do we really need this data?

    Using a custom object (or leveraging the Case object with a unique Record Type), you can easily build a tool within Salesforce to track, approve/deny changes, and have a historical reason of “WHY” you built a certain field, process, email alert, workflow, etc.

    Salesforce Change Request Template

    The template I use to manage the change has a few components, which can easily be updated and extended to your particular Org’s needs.

    Template of Salesforce Change Management

    A. Change Request Name:

    This field provides the name of the change request, which, at quick glance, should display a high level overview of the objectives of the change from the requestor.

    B. Change Stage/Status:

    I use the below drop-down selections to understand where a change is in it’s life-cycle.

    -Not Started
    -Approved
    -In Process
    -Completed
    -Denied

    Here, you can have workflow rules & approvals. When a change is created, it can send me an email of a new change with some of the information. I can quickly take a look and approve/assign it to the appropriate person to follow up. In rare cases, I will deny a request. Once approved and assigned, it will be moved to in process until completed.

    C. Change Requestor:

    This field is used to understand who is requesting this change, and is used to send an email alert when it was successfully logged, and can email when completed/denied. This closes the loop for the parties involved.

    D. Change Date Fields:

    Two important date fields I leverage are:

    -Date Requested: This field is updated when a Change record is created.

    -Date Completed: Once stage is marked to completed, it will update the date field to TODAY(). This is when it is moved to either Completed or Denied.

    E. Change Owner:

    Who the Change owner is assign to complete the task. When the ownership is changed, an email alert can go out to update the assigned owner. All changes are assigned to me as the owner, and then I can easily update that and have an automated email go out to the newly assigned owenr.

    F. Change Description:

    This field is required to create a change. The change requestor will fill out what is being asked. These projects can be something that can take as little as 5 minutes, such as adding a picklist value to a field, to up to several months – such as tracking a project and the sub-requirements of that project. Sometimes changes prompt the need for more information, and this can be tracked in the notes/attachment related list of the record, or as a working revision in the ‘results’ section.

    G. Results:

    The result field is used to explain the methodology used to perform the task. Typically what is included the URLs of the fields, the field names, and any other comments relating to the results. This field is very important to use for historical tracking of why a field was created, and what are all the components of the change that were used to solve this particular initiative.

    Salesforce Change Request App

    Instead of recreating the wheel, you can also easily download a change request app from the Salesforce AppExchange. The app I use is called Change It. I wanted to give a shout out to CloudLogistix who created this app back in 2007. I still use it to this day. You can, of course, easily create a custom object or update the Case record to solve this, but out of the box it works great, and has the majority of the above fields & created list views. You will need to have an admin create the workflow rules and email alerts, but it is great if you don’t want to hit the soft limit of the allowed workflow rules.

    Hope this has shed some light into how I handle change management in Salesforce. If you have any questions or comments, please don’t hesitate to reach out to me at the contact form or in the comments below!

  • What You Need To Know About a Net Promoter Score (NPS) Survey

    What is the Net Promoter Score and how can you use it to understand how you are doing with your customers? This article will cover everything you need to know about the Net Promoter Score, and how to build an NPS Survey.

    Net Promoter Score Definition

    The Net Promoter Score is a metric that is promoted as being correlated to ‘Customer Loyalty’. Originally created by the consultancy firm, Bain & Company & software firm Satmetrix; the score is based on a simple scale of 1-10.

    Faces of the different net promoter scores
    The types of Net Promoter Score responses you can expect to receive.

    When a respondent’s score falls within the 9 or 10 range, they would be considered Promoters. Promoters are your loyal customers who will advocate internally and act as your customer champion.

    People who respond with a score between 7 or 8 are known as Passives. Passives are customers who may be satisfied, but most likely will not go out of their way to sing your praises or be a customer advocate.

    At the other end of the spectrum – if the responses to your survey fall within 0-6 on the scale, the respondents would be considered Detractors. Detractors on the NPS survey are respondents who would be those unhappy customers who do not enjoy your product or service, and may speak badly to friends or colleagues.

    Net Promoter Score Questions

    The Net Promoter Score, as designed, is based on only one question:

    On a Scale from 0-10, with 10 being the highest – how likely are you to recommend our product to a friend or colleague?

    This question should allow a selection of scores on a scale of 0-10, and is typically followed up with an opened ended question. Why?

    The question begs the question “Why did you respond the way you did?” This answer is more qualitative in the results – meaning you cannot lump these responses without further manipulation of the data set. This “Why?” follow up question has responses that can range from describing the ease of use of your system or tool, their experience within the customer journey, and much more.

    Net Promoter Score Calculation

    The Net Promoter Scores are not necessarily calculated by taking the average (the mathematical ‘mean’) of the responses, but by taking the percentage of where the detractors respond, minus the aggregate percentage of promoters – to get your score. While complex, the simple methodology we’ve found that works is to just take the average ‘mean’ calculation:

    Based off of the numerical responses in the survey, you will have your overall NPS score. Below, I will share an example of two years of Net Promoter Score results. Let’s say that in the 2015 survey, let’s imagine we had two results, 7 & 8, when added together = 15, and divided by the two responses leaves us with a score of 7.5. However, in 2016, we had three responses, 8, 8, & 10. These summed will be 26, and divided by the three results leaves us with a score of 8.67.   In this figurative example, the scores are improving, from 7.5 -> 8.67 – which would indicate a good sign overall. Visually, this will look something like the below:


    Two NPS Survey Results Calculated
    Ideally, all your customers would have your survey results fall in the 9/10 range, show in the above gauge as falling into ‘green’.

    Net Promoter Score Example

    The Net Promoter Score is not just the question, “On a Scale from 0-10, with 10 being the highest – how likely are you to recommend our product to a friend or colleague?”, but should also include an open-ended question to have the respondent explain the reasoning behind their given score. This qualitative feedback can provide insight on where you can improve your business, & what your customers view you are doing well in. Open-ended responses can be along the lines of “I’ve received terrible customer service/support” to “Your rep, X, has been a pleasure to work with”. Taken along with the score, you should  be able to paint a good picture on where your customer’s loyalty is.

    Why Use the Net Promoter Score?

    The Net Promoter Score is not without it’s criticisms, however, can show year over year growth based on the feedback from the team given the survey results. I will list some of the criticism I’ve experienced below.

    Closing the Loop

    One potential pitfall of just relying on the just the Score from the NPS survey is not closing out the loop with customer by providing feedback. While a generic “Thank you for your response.” is great, following back up with the customer in an individualized manner will give you a chance to share your appreciation of their feedback more. This is especially in the case of your Promoters/Champions. Close the loop with your customer and thank them for their time, and let them know that their feedback will be discussed internally and help address any issues that they are currently facing.

    Personalization

    Since the NPS Survey will take into consideration overall teams or your entire customer base, it sometimes loses the individual aspect of it. By diving deep into the follow up “Why?” question and looking at individual responses, you can avoid the pitfall of viewing the lump score. This also relates the closing the loop, in that you need to not only look at responses and see the forest for the trees, but you also need to dive deep and inspect each tree. You need to understand what made a detractor give their negative review, and what a promoter has said to give the positive response. These responses may not be mutual exclusive, or they may be entirely uncorrelated. An example could be that a detractor hates the interface, but the promoter loves it – by digging into the personal responses, you realize that the Detractor uses Internet Explorer, while the Promoter uses Chrome. A potential fix can be to either show a message on IE that it is unsupported, or work to support IE for your customer base. Another answer could describe the increasing cost of your service, while a factor to consider, should provide insight into why they responded the way they did.

    How Do You Improve?

    Ultimately, the NPS Score is meant to gauge where you stand with your customer base, and set a course on how to improve. With a constantly changing market landscape and customer base, this can be a slippery slope if it is the only score you use to drive forward your business. If a company focused all of it’s resources on improving the NPS Score – other things such as profitability, time to market, etc can fall to the wayside.

    I am a proponent of using data points such as the NPS Score to influence how a company can improve. Now that you understand what the Net Promoter Score is, and why to use it – what are your thoughts on it? What other metrics do you use to see how well your organization is doing? Feel free to reach out, or let me know in the comments!

  • How to Insert a Salesforce Image Using a Formula

    Being able to insert a salesforce image using a formula is very easy to implement, and can act as a visual cue for a variety of use cases. Recently, I had a request to flag accounts with bad payment statuses on a custom object record used by the implementation team, because at a certain point the customer’s access would be restricted causing the engineer to be unable to have meetings with the end users. Other reasons for using visual representations can be showing where an opportunity stands (red, yellow, green) when closing, using a lead score to see how hot the lead is (with flame images), or using an account score and how close a prospect is to your ideal customer profile (with stars), etc. Adding a field to Salesforce that will display as an image requires a few steps, but we’ll walk through it with screenshots below.

    How to Insert an Image in Salesforce

    To insert an image in Salesforce, we’ll first have to upload the image into Salesforce. The recommended way is to upload the image in the Documents Tab. To head to the documents tab, click the plus sign in the menu to view all tabs. Then select the Documents tab.

    The second step is to create a read only public folder visible to all users, or take an existing folder and set the access to ‘read only’ accessible by all users. I’ve named mine SFDC Images below:

    Now that we have the folder set up, we’ll need to actually upload the pictures. I searched Google for a white flag Icon that was free (creative commons), and downloaded it to my computer. From there, I painted in some colors (green, yellow, red, black), and shrunk the size down a bit. Here they are if you’d like to use them in your own Org:

    Next, you’ll want to create a new document, and give it a name. Make sure you have it saved in the public “SFDC Images” folder. From there, upload the image by selecting ‘browse’ in the second section. Do this for all the images you want to upload.

    Creating Green Flag in Salesforce Documents

    Now, you want to click ‘view file’ to get the url. We’ll save everything after http://[…].content.force.com (what you will be copying is the /servlet/servlet.FileDownload?file=01541000003RMXC‘).

    Salesforce Document ID

    Once we have the location URLs saved for all images, we can create the field that will display them. Select the create new Field on the Object you want to display the images. For this example, we’ll create one on the Lead Object.


    Select type “Text” for the data the formula will return, and give it a name:

    In the formula builder – we’ll want to go to “Advanced Formula” tab. The formula I’m making will be using the CASE logic.

    Custom Salesforce Formula Displaying Image


    What this formula does is lookup the Lead’s Score, and if the picklist value is ‘Medium’ , it will display the Yellow Flag. If the Lead Score = “High”, it will display the Green Flag. All other times it will display the Red Flag. The Image function has two variables, the URL of the image, and the name of the image. Here is the formula below if you’d like to copy and paste to update yourself.

    CASE( Lead_Score__c,
    “Medium”, IMAGE(“/servlet/servlet.FileDownload?file=01541000003RMXM”, “Yellow”),
    “High”, IMAGE(“/servlet/servlet.FileDownload?file=01541000003RMXC”, “Green”),
    IMAGE(“/servlet/servlet.FileDownload?file=01541000003RMXH”, “Red”)
    )

    Save the formula, and add it to your page layout on the record type you want to display it on. Once you have updated the layout, let’s validate this by going to one of our ‘test’ records, and moving the Lead Score and verifying that it works. Congrats! You’ve inserted an image into Salesforce using a formula.

    Testing if the lead score is medium:

    Testing if the lead score is high:

    Has this helped you out at all? Let me know if the comments below! Also, if you have any other use-cases where you need to add an image that displays through Formula logic, please share it with me.

  • Campaign Member First Associated Date on Records

    If you had an issue finding the member first associated field on the campaign member, you are not alone. Here, the campaign member first associated date field is an available field column in the Campaign History related list of a Contact or Lead record:
    Salesforce Campaign Member First Associated Date Field

    However, if you were to try and reference this field in a formula, workflow rule, etc, it would not be not available in the options. For example, please see the below – this is a screenshot showing the picklist in the formula helper on the Campaign Member object:

    Available fields on the salesforce campaign member
    There is no field on the Campaign Member object with the label “Member First Associated”. Where did it go?

    How can this be referenced in the related list, but not reference-able anywhere else? As it turns out, this is because the Column header label in the related list is actually referencing another field.

    As it turns out, the Member First Associated Field is really just the Created Date of the campaign member!

    It makes sense when you think about it. A Campaign Member is first associated when the record has been created on the Contact or Lead record, as referenced through the related list. Let’s see how we can use it in a formula:

    Using the Campaign Member First Associated Date field in a Formula

    If you wanted to reference the Member First Associated in a field of a formula, it is very easy to do. Note: The “Created Date” field is a DATETIME field, and you may need to convert the DateTime field to a Date value if you are using it with another Date field like in the below formula.

    Using the Campaign Member Created Date field as a DateTime value to Date Value

    In the above, we have a simple IF statement seeing if the Effective Date field on the Account related to the contact is greater or equal to the creation date of the campaign member of the related Contact. If the effective date is greater or equal to the campaign member first associated date, we’ll have the formula say No, otherwise it’s Yes. What this formula is seeing is if the Contact was a member of a campaign on before or after the account became a customer. As a reminder, we use DATEVALUE() instead of DATE() because it will correctly convert it to a date field.

    I hope this article helped clear out some confusion of the Campaign Member First Associated field! Would love to hear your thoughts in the comments below, if this helped you out or not!

  • Mass Updating Salesforce Records with a Checkbox

    Sometimes you will need to mass update all or a subset of records in your Salesforce Org. Being able to mass update Salesforce records with a checkbox is one of my all time favorite admin ‘hacks’. The way to implement is to create a checkbox only visible to the System Admin profile, and use it with your favorite tool – whether it is using Data Loader, Workbench, X-Author, or Demand Tools to check that box – you can update a subset or all of your records. How is this possible?

    How to Mass Update Records in Salesforce

    There are many reasons to mass update records in Salesforce. Let’s say that you just created a workflow rule or used process builder to build a process that will update records when ‘created or edited to meet the criteria’. What do you do for the records that might not have been updated after this rule has been created? That’s what this checkbox is great for!

    After the workflow rule or process is built, you would need to make some sort of update to each record, regardless if the the criteria is met, to enforce the record’s rule or process is run. Let’s walk through the process of how to build this checkbox updater:

    First, let’s create the checkbox. In this example, we will create  this field on the Account object. We can just use the name, “Value is Updated?”. Have the default value of this field be ‘unchecked’. Let’s make this field visible and editable to only System Administrators, and assign to the Sys Admin page layout (if you have one available). The result will look something like this on your page layout:

    Checkbox to automatically update saleforce records

    Now, say you built a new workflow rule that will run anytime a record is created or updated to meet the criteria. You can manually go through each of the Account Records and make a slight edit on the page, to have the workflow rule run.

    But what fun is that?

    As an administrator, we like to automate as much as possible, and use ‘clicks not code’ to do so. In this situation, just pull a filtered report with all the account ids and this checkbox field. Once the CSV has been exported, let’s mark the checkbox as “True”. We do this by the 1/0 true/false statement, where 1 means true. Since the default is set to 0, we’ll set as one.

    Account IDs updated with the Value Is updated Checkbox

    Save the CSV, and pull open your favorite ‘bulk updating’ tool. I prefer to use Salesforce’s own Data Loader. Open up the Data Loader, and select the “Update” button.

    data loader salesforce open

    You will most likely have to log in. Once you login, you are able to select the object to update. In our case, select the Account Object and open up the CSV we just saved. Match the column header names with the corresponding fields in Salesforce, and confirm update:

    By making an update to a record through a field that has no real impact on business processes, this will then take a look at any Salesforce process or workflow rule, and will cascade the rule throughout all the records that were ‘updated to meet the criteria’. Congrats, your rule has been created and applied to all the records you had in the original report!

    What are your thoughts on this simple hack? As a Salesforce admin, do you have any other tricks used to make your life easier? If so, share them with me in the comments below!