Are you trying to find where your top customers or prospects are located geographically? Being able to visualize this data in a heat map can help you figure out your top target customers, manage territory realignment, increase headcount in a certain area, and many other use cases. This article will go over how to generate a geographic heat map by using Salesforce Account Data, in particular, we will be using just the Zip Code information of account records.
This tutorial uses Google’s Fusion Tables that can be a accessed from your Google Drive. What is phenomenal about Fusion Tables is that it is a great visualization platform that can create bar charts, pie charts, and what we’ll be using – Geographical maps – from any source of data you provide.
Getting Started with Google Fusion Tables
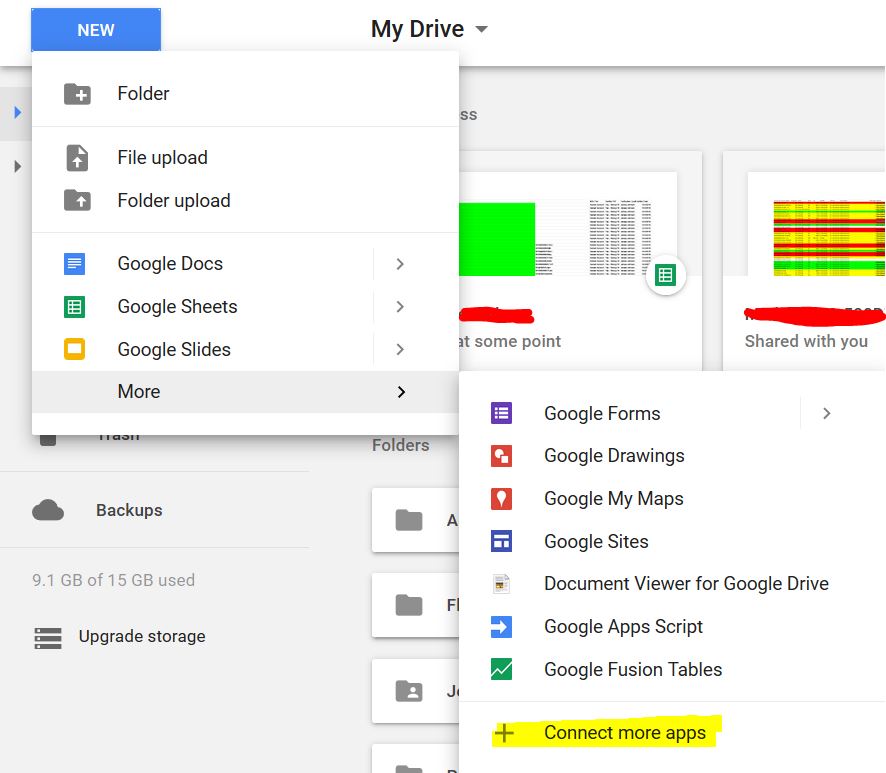
You can possibly skip this section if you already have access to Google’s data visualization tools. To get started, we’ll first head over to Google Drive. If you don’t already have a Google Account, go ahead and create one. Once there, we’re going to have to connect Fusion Tables to your drive:
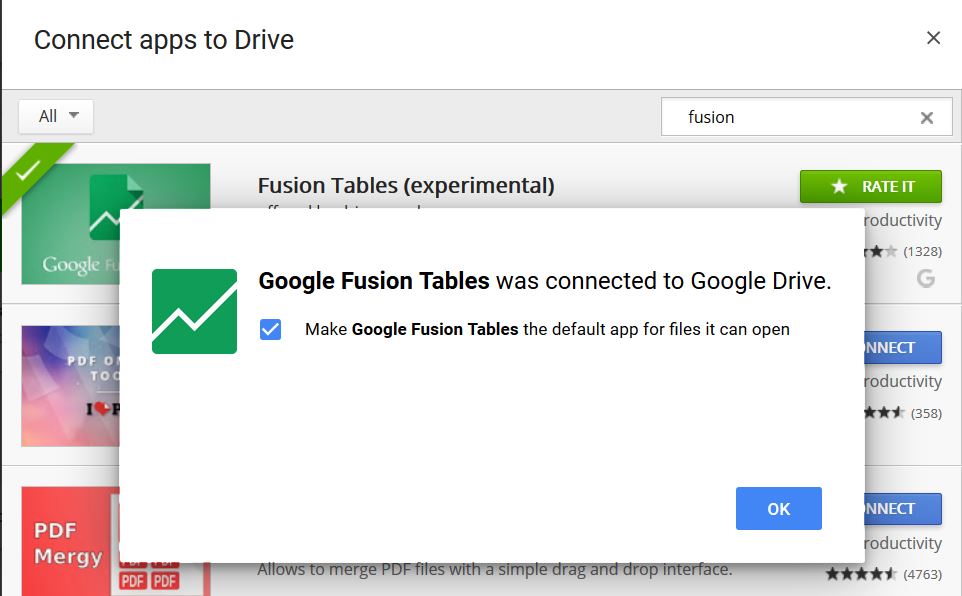
As you can see in the above image, I have already connected Fusion Tables, but if it’s your first time – once in Google Drive, Select “New” and then”More”, from there, click the ‘connect more apps’ for the search screen to show up (below). Once it does, search for “Fusion” and click ‘Install’ next to it to associate with your Google Drive:
Congrats, your Google Drive now has Fusion Tables! This next section will briefly go over exporting a report in Salesforce – if you already know how to do that, feel free to skip to the section after that.
Exporting a Salesforce Report
Next, you’ll want to have an export of the data you are trying to visualize. You can get that data by creating a report in Salesforce, select the Account Report type, and pull out any relevant data within the filters. We opted for Dummy Customer Accounts in our Sample Zip Data CSV. In the columns of your report, specify ‘Zip Code’ as one of the data points that we want to export. The Zip Code data will allow us to map with the help of Fusion tables & the Google Maps API. Once your report is created, let’s export the report as a .CSV.
Now that we have our data, it is time to upload this to Google’s Fusion Tables.
Using Google Fusion Tables to Create a Heat Map
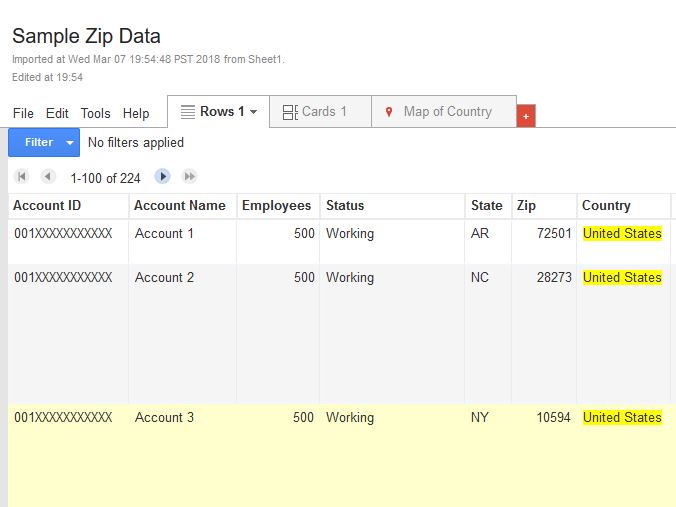
Let’s fire up a new Fusion Table. Go to Google Drive, and Select “New” -> “More” and then “Fusion Tables”. Once there, it will prompt you to Import a new fusion table. Select the CSV of the report that was generated earlier. As the data populates into the Fusion Table, it will look like the below:
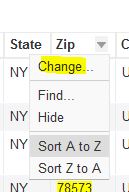
By default, the table will associate the ‘location’ as the target data point to visualize (do you see how the United States Country is highlighted?). It is easy to adjust a different column to be the data source. Just hover over the area at the header of the column, and click the arrow as it appears, and select ‘Change…”.
This will allow you to adjust the data ‘type’ of the column to be Location (from the default “Number” that Fusion Tables associated it with).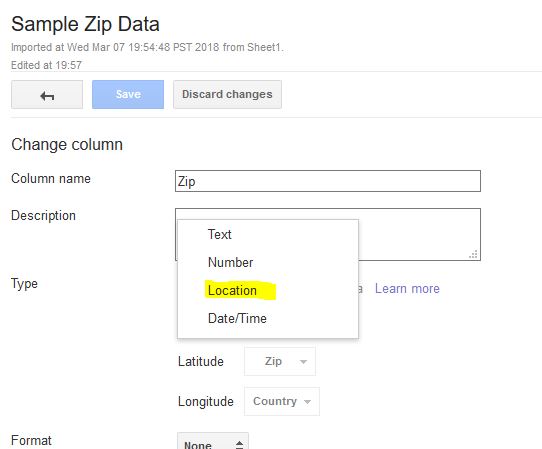
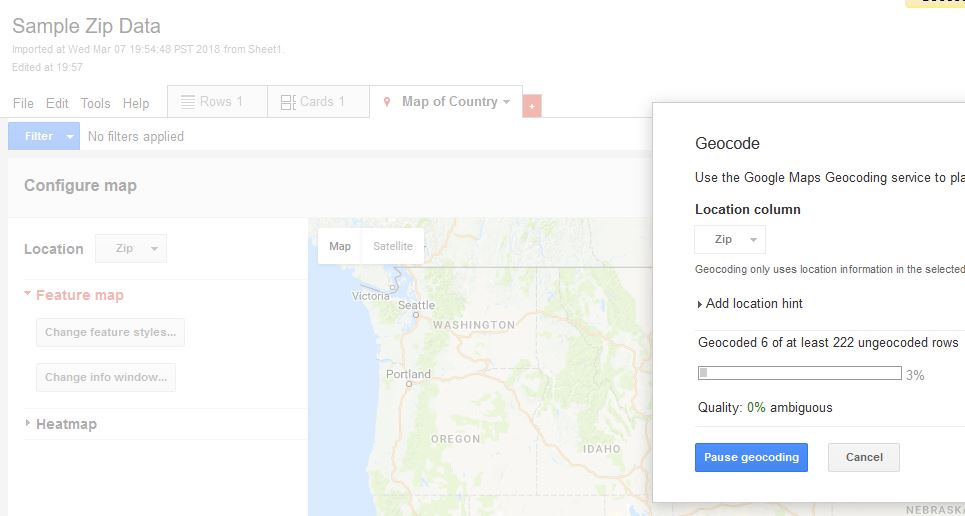
Now that the Zip Code column is referenced as a location, in the “Map of Country” tab, we’ll select Zip as the location. Once you select this, Fusion Tables will start Geocoding for you.
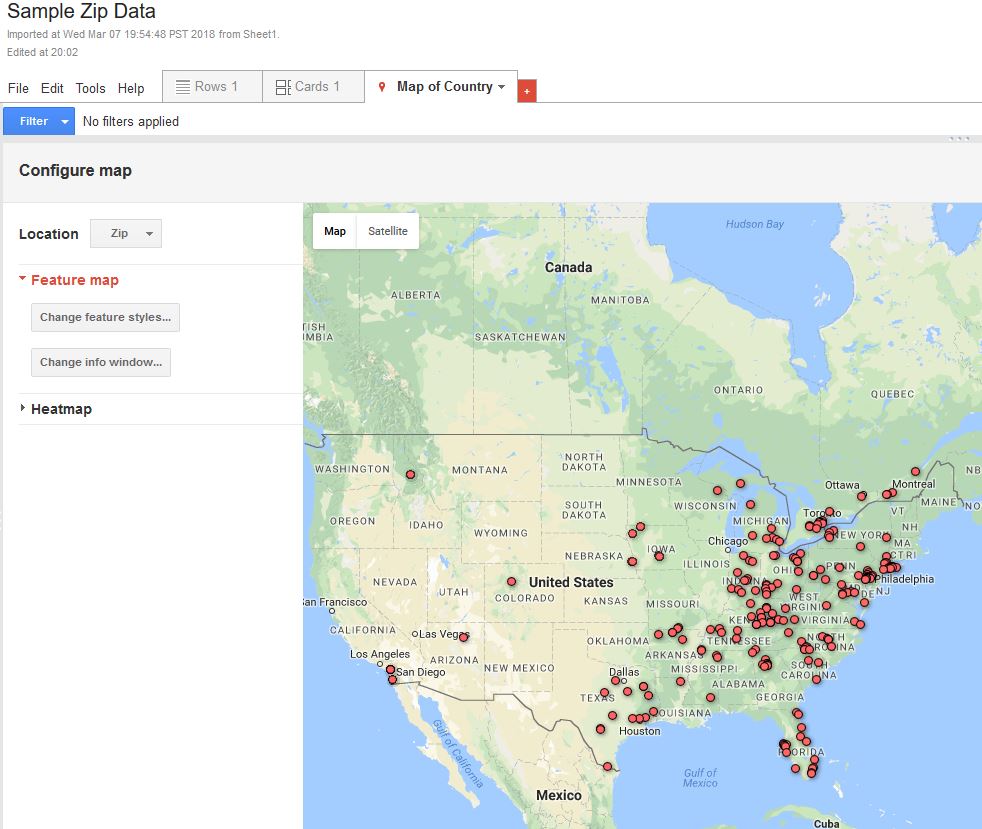
After Fusion Tables has finalized the Geocoding, you will see a plot map of your Zip Codes:
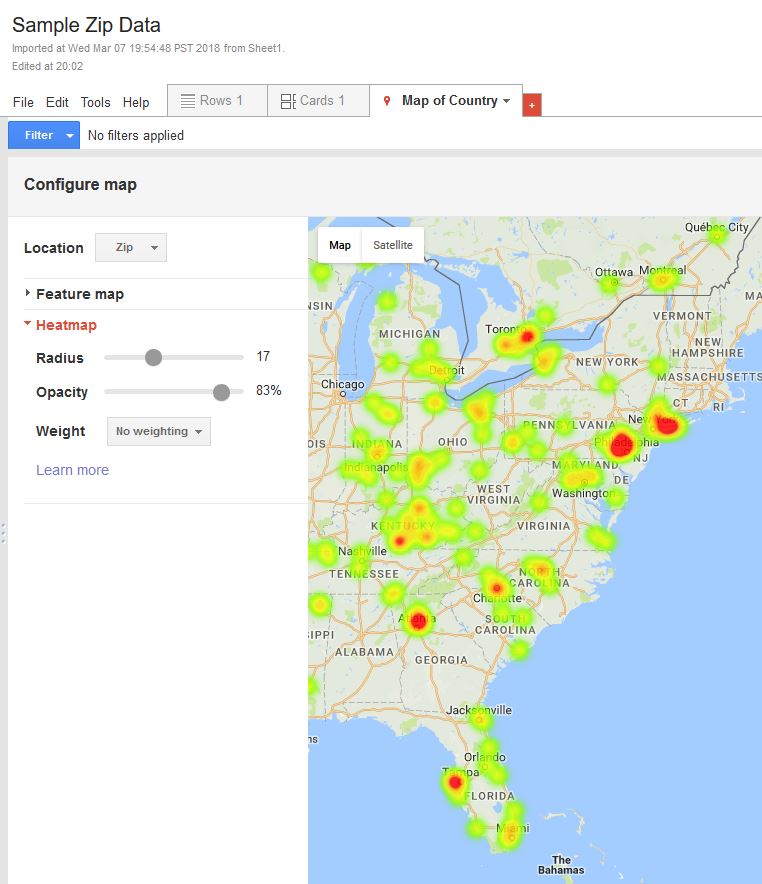
It is very easy to adjust the map from displaying ‘plotted’ points to a heat map. In the left side bar section, Click “Heatmap” under “Feature map”:
As you can see in the above image, we’ve successfully created a heat map! You are easily able to adjust the radius and the opacity of the map from this selection, making cities larger or darker should you prefer. It appears the majority of our sample Customers are located in Tampa, Atlanta, Philadelphia, Toronto, & New York. If our purpose was to visualize what cities we’d need to have a resource location near, this heatmap can easily serve that purpose.
Feel free to reach out if you have any additional questions. If you have other uses for Fusion Tables or use-cases for Heatmaps, please leave them in the comments below!
